
curious
-
Posts
7,157 -
Joined
-
Last visited
-
Days Won
167
Content Type
Profiles
Forums
Articles
Videos of the Month
Major Race Contenders
Blogs
Store
Gallery
Everything posted by curious
-
Finally a reason NOT to emigrate to Australia!
curious replied to Chief Stipe's topic in Galloping Chat
Can't I don't think. From the Human Rights Commission site and that's for an employer which NZTR aint of racing participants, but racing rules can't override other statutes including Human Rights Law: Can my employer require me to have a vaccine? New Zealand's primary workplace health and safety regulator, Worksafe, has produced a guide to assess whether a specific role needs to be performed by a vaccinated worker. The guidance states: Businesses and services can’t require an individual to be vaccinated. However, you can require a specific role be performed by a vaccinated person - if you have done a health and safety risk assessment to support this. -
Finally a reason NOT to emigrate to Australia!
curious replied to Chief Stipe's topic in Galloping Chat
Was just talking to a Mental Health Emergency worker who as part of their job moitors ED admissions in case they think they need to be involved. They reported 2-3 admissions a day at the moment due to vaccination side effects at the hospital where they work. Mostly chest pain. -
Got a favourite one liner?
-
Racing Today 1 September 2021 - 2 NZ and 5 OZ meetings.
curious replied to Chief Stipe's topic in Galloping Chat
Haven't had a tote bet so don't know about that but I use fixed staking FOB and haven't yet figured out how to get it to automatically enter that stake each time I bet like you can with other provider interfaces so have to manually enter for each bet or copy paste. -
Racing Today 1 September 2021 - 2 NZ and 5 OZ meetings.
curious replied to Chief Stipe's topic in Galloping Chat
Yes, fair comment. They may not have credit cards but neither do I. Everyone surely has a debit card though. You can't exactly pop down to your local pubtab abd cash a check anymore. You'd think the TAB would have (at least since last year's lockdown, identified regular punters who may be in this situation and aimed some education/ promotion there if as a group, they are important as customers. -
Racing Today 1 September 2021 - 2 NZ and 5 OZ meetings.
curious replied to Chief Stipe's topic in Galloping Chat
Globally last year, overall gambling reduced because of lack of access to land based gambling. In NZ, that had a positive impact subsequently on problem gambling. A post lock down re-assessment in June 2020, found that reduction in gambling relative to pre-pandemic was maintained, and that the proportion worrying about their gambling reduced from 17% during the lockdown to 11%. -
Racing Today 1 September 2021 - 2 NZ and 5 OZ meetings.
curious replied to Chief Stipe's topic in Galloping Chat
I think if they can't be bothered, especially in lock down, we certainly shouldn't be relying on them. -
Racing Today 1 September 2021 - 2 NZ and 5 OZ meetings.
curious replied to Chief Stipe's topic in Galloping Chat
Absolutely no difference for me getting bets on (80 odd bets since Wednesday) Don't see why Covid would change that. -
Racing Today 1 September 2021 - 2 NZ and 5 OZ meetings.
curious replied to Chief Stipe's topic in Galloping Chat
Doesn't seem that long ago that NZTR thought Monday racing was going to save us. -
Racing Today 1 September 2021 - 2 NZ and 5 OZ meetings.
curious replied to Chief Stipe's topic in Galloping Chat
Gosh. BF had over 18k win matched on the Foxbridge and 22k place. They'll pass the TAB tote soon at that rate. -
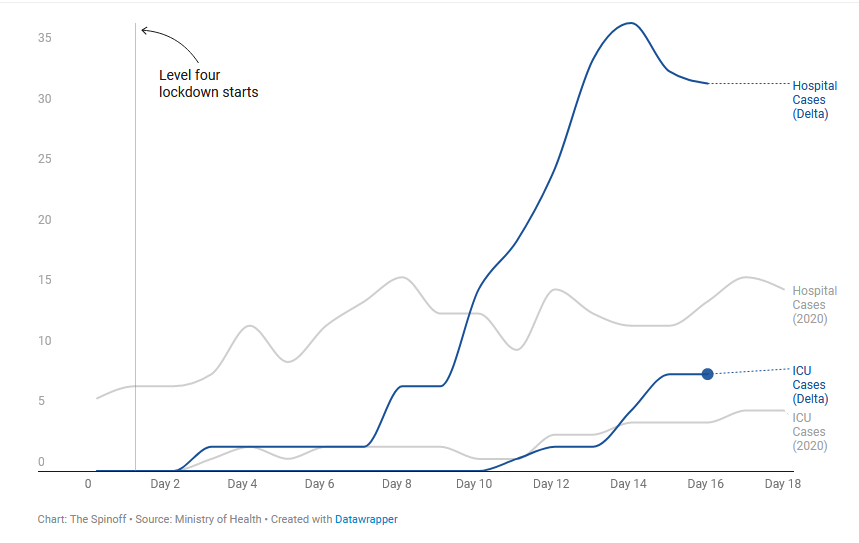
How long will we remain in Level Four in New Zealand?
curious replied to Gospel of Judas's topic in Covid-19 and Racing

-
Critique of Doshi. https://absolutelymaybe.plos.org/2021/08/31/this-waning-immunity-argument-against-the-fdas-covid-vaccine-approval-is-a-scientific-quagmire/
-
Racing Today 1 September 2021 - 2 NZ and 5 OZ meetings.
curious replied to Chief Stipe's topic in Galloping Chat
Sounds like Greyhounds could be gone. Horses might follow. Worse if we hold on and they include revenue from overseas greyhound racing in any prohibition. -
Racing Today 1 September 2021 - 2 NZ and 5 OZ meetings.
curious replied to Chief Stipe's topic in Galloping Chat
I suppose it depends what you mean by "spelling". I don't see how you could do that for much under $40 a day and I also don't see how you could train one with a small profit for much under $100 a day. -
Racing Today 1 September 2021 - 2 NZ and 5 OZ meetings.
curious replied to Chief Stipe's topic in Galloping Chat
I don't see how they could be more than paying their way at those rates if staff etc. are being reasonably compensated. -
Racing Today 1 September 2021 - 2 NZ and 5 OZ meetings.
curious replied to Chief Stipe's topic in Galloping Chat
Cup meeting not far away but I still have not seen nor heard anything from the CJC and/or NZTR about plans for fixing what once was one of the better tracks in the world. -
Racing Today 1 September 2021 - 2 NZ and 5 OZ meetings.
curious replied to Chief Stipe's topic in Galloping Chat
`Yeahh, costs have to be similar. Stakes here have to be way less because that's what we can afford based on revenue. -
Racing Today 1 September 2021 - 2 NZ and 5 OZ meetings.
curious replied to Chief Stipe's topic in Galloping Chat
Nope. Just shortens the price. -
Racing Today 1 September 2021 - 2 NZ and 5 OZ meetings.
curious replied to Chief Stipe's topic in Galloping Chat
Oz have the revenue from racing to support their stakes today. NZ doesn't have the revenue to support the stakes you cite.They need to be reduced. I thought that was the point? I missed it as well then. -
Spare a "Be Kind" thought for our dear old @Thomass
curious replied to Chief Stipe's topic in Galloping Chat
-
How long will we remain in Level Four in New Zealand?
curious replied to Gospel of Judas's topic in Covid-19 and Racing
Seems promising to me. -
How long will we remain in Level Four in New Zealand?
curious replied to Gospel of Judas's topic in Covid-19 and Racing
I agree. If re-opening is contingent on a substantial proportion of the population being in an effective vaccination status by the end of the year say, re-opening can't happen based on the current vaccine strategy and the evidence at hand. Even the short-lived re-opening strategy with Australia has failed miserably and any re-opening is as much dependent on the rest of the world as it is on NZ. We may be in our own national bubble for some time to come. -
How long will we remain in Level Four in New Zealand?
curious replied to Gospel of Judas's topic in Covid-19 and Racing
Why? Given that even freshly vaccinated, the benefit evidence against Delta is doubtful, if the current outbreak is quashed in NZ and there is no other and therefore no risk for say 6 months, it will certainly be largely ineffective by then, especially against any new variant. Already those who were vaccinated early, in Feb and March probably would have little protection against a new variant. -
How long will we remain in Level Four in New Zealand?
curious replied to Gospel of Judas's topic in Covid-19 and Racing
Isolated case but this sort of stuff keeps me wavering on getting the jab. -
How long will we remain in Level Four in New Zealand?
curious replied to Gospel of Judas's topic in Covid-19 and Racing
I haven't seen any media reports only the MoH release. However wouldn't a drop in testing rates likely be due to a fall in new close contact numbers and people experiencing symptoms, so be expected?