
-
Posts
484,445 -
Joined
-
Last visited
-
Days Won
662
Content Type
Profiles
Forums
Articles
Videos of the Month
Major Race Contenders
Blogs
Store
Gallery
Everything posted by Chief Stipe
-
Where's your evidence?
-
Totally stupid. This Penn National rubbish continues to get served up - why I have no idea.
-
Perhaps the horse hadn't seen the green stuff before.
-

Brain De Lore's OUSTANDING take on things Racing recent
Chief Stipe replied to Thomass's topic in Galloping Chat
Seems the word "fraud" has expanded in its definition! However Curious Thomass isn't alone in his belief. I'm sure some breeders, owners and trainers also adhere to it. That in itself explains some of the problems we see in the industry. -
Don't you walk one of those wheels around the course a couple of horse widths out from the rail? With regard to the penetrometer I'm convinced that the measurements at Riccarton are off.
-
Thanks Pitty. That explains why a D4 at Riccarton is different from a D4 at Reefton. Also explains why a maiden can run 1:07 on a D4. Now you are also inferring that all penetrometers are the same and don't alter in terms of their accuracy over time and use. I find that hard to believe.
-
There should be statutory minimum bet limits especially if the Government and the Industry Administrators wish to further enforce a monopoly position. Not that I think they can do that effectively!
-
Brain De Lore's OUSTANDING take on things Racing recent
Chief Stipe replied to Thomass's topic in Galloping Chat
You are wasting your time Curious. Thomass has never understood this. An R65 is an R65 on any day of the week. You don't have a 'B' Grade R65 on a monday and an 'A' Grade R65 on a Saturday. Certainly the handicapper doesn't see it that way otherwise the system would be even more stuffed up than it is! -
I think PlanB and their group of scientists along with their colleagues in other parts of the world provide a balanced view of the pandemic based on good evidence based research. Unlike the celebrity styled scientists of dubious backgrounds that advise our NZ Government. However I understand that I have an advantage having been formally trained in the scientific method and evidence based research.
-
But what you write indicates that you don't really know what you are talking about. Big deal. You are not even trained to be a good Business Intelligence Analyst. Quite frankly I've yet to meet a good one! A three year degree in Computer Science (did you finish it?) falls well short in training for it. Certainly your inability to understand evidence based research (and no training in it) and to isolate your biased thinking to enable the clear determination of "insights" makes you a crap BIA. You should have stuck to selling and designing MS SQL systems - a bit of bullshit goes a long way in that game! Which have nothing to do with differences in their respective pandemic management approaches. However you are unable to distil those factors and find the key relationships. You only present macro indicators without adjusting for the unique characteristics of the respective economies which are significantly different. You first raised the relative increases/decreases in Government debt not I. Then the moment I pointed out that metric was useless as a measure you went on another tangent. Quite frankly I won't be giving any credence to any business intelligence "insights" you may give on the comparative economic performances of Nordic countries.
-
You are completely wrong in saying Norway and Sweden are similar! FFS do some analysis beyond your predetermined bias! Sweden - twice the population of Norway. Sweden - oil importer - Norway oil exporter. Sweden - large tourism sector - ski resorts reliant on external and internal tourism. Sweden relies on other countries more than Norway for its economy. Sweden - has a comparatively larger immigrant population and more recently this has grown with Sweden's comparatively more open immigration policy - the largest grouping is in Stockholm which drove the first Covid-19 peak. Sweden of all the Nordic nations has the largest nursing home population and one that is considerably older. Although Sweden didn't lockdown its messaging to its population resulted in a drop in public and private consumption. Plus the big whammy was the decline of 18% in the export of goods and services. Norway is much more insular than Sweden. Culturally Norwegians are different to the Swedish. This can be partly explained by the differences in geography - Norway is a land of Fjords and mountains. And so on and so on.
-
Again you are letting your bias affect your analysis - not good for looking for "insights". Your hypothesis that the RATE in increase in Government debt per capita is greater for Sweden than Norway may well be correct. However that doesn't provide conclusive evidence that Sweden's approach hasn't been the right course for their economy. On its own your chosen metric means nothing. You aren't really all that good at this are you?
-
Norway and Sweden's Q3 GDP figures are surprisingly similar being 4.6% vs 4.3% respectively. Of course Sweden was impacted more than Norway in Q2 but that would have been worse if Sweden had implemented draconian lockdown measures. Sweden relies more on open borders than Norway.
-
I wouldn't be so sure of that. I've just reviewed the last three months - September, October and November. Sept and Oct had considerably lower deficits than forecast and the surplus in November as I said was up by a significant amount. Now you are searching for data to support your hypothesis (bias?) that Sweden is doing much worse than Norway in overall pandemic management. I'm not even sure you read the paper that PlanB posted which demonstrated that a substantial amount of the Covid-19 mortality in Sweden was in fact displaced mortality from the previous period of negative excess mortality. Their data was comparing June years i.e. the first peak of the pandemic however the ensuing months have continued to supported their conclusion with no increase in excess mortality.
-
Just reviewed the data from the Swedish National Debt Office - Government debt in Sweden has declined in the last month with revenues 100% more than budgeted.
-
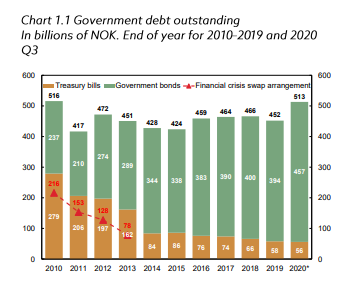
Of course you don't see the point as you are a Business Intelligence expert who like many such types don't understand time and variation. That graph shows the level of debt as of the end of the September Quarter 2020. It comes from the official stats of the Bank of Norway. Sweden has also increased their debt but not at the same rate as Norway. The per capita debt for Sweden is considerably less than Norway. You posted a comparison between Norway and Sweden increases in debt showing a single figure amount to infer that Sweden was doing worse. A brilliant business insight that didn't take into consideration the differences in population nor nominal GDP. Misleading at the least.
-
Overall for the YTD it is up substantially on last year. The highest it has been in 10 years.

-
As the renowned Business Intelligence Analyst (self-proclaimed) that you are I was very surprised when you used GDP growth as a comparative measure of Covid-19 pandemic management. Anyone with any degree of analytical skill would know that that metric in itself is flawed and certainly more so when used the way you did. Monetary Tools such as the increased use of the new fad of Quantitative Easing has made GDP a poor comparative metric.
-
I hope you don't use the Riccarton penetrometer - it needs calibrating.
-
You should really stick to topics you vaguely know something about. Very easy to prop up GDP figures when you borrow or print money aka NZ. Suggest you go have a squizz at the comparative debt per capita.
-
'Cause Thomass is a dedicated follower of fiction' https://youtu.be/tqXrAHuLksU
-
Was that a Taranaki District Councillor?
-
What's this to do with racing?
-
NZTR/RIU's APPALLING handling of Jockey J. Waddell
Chief Stipe replied to Thomass's topic in Galloping Chat
Oh it's the season to be jolly.....silly season. Here we have two people that have probably spoken to CWJ recently and are saying Thom-ass is wrong. Then we have Thom-ass who is writing fiction and quoting a journalist. Although calling Guerin a journalist is probably a stretch. -
NZTR/RIU's APPALLING handling of Jockey J. Waddell
Chief Stipe replied to Thomass's topic in Galloping Chat
Definitely Christmas anxiety. Thom-ass is back to writing fiction.